
The problem in one sentence
AI spend is easy to see. AI surplus is not.
Boards approve AI budgets because competitors are loud and vendors are present. In a mid-market firm, the first visible result is often the invoice: licences, consulting days, integration work, and senior review time. Months later, finance asks where the surplus is. Teams point to usage dashboards. Usage is not surplus.
Productivity paradox, plainly: widespread AI activity coexisting with weak enterprise-level financial impact because work systems did not change. In practice: Copilot seats appear in OpEx every month; the P&L still looks like last year because invoice processing still runs on the old chase workflow.
What you see globally right now is a seat-count narrative: every suite adds AI, every vendor shows adoption graphs, and Silicon Valley treats usage volume as proof of transformation. McKinsey’s 2025 survey crystallises the paradox: near-mainstream use inside organisations, narrow enterprise EBIT impact. Gartner’s projection of widespread GenAI application use by 2026 explains why spend and activity rise. Neither number excuses a missing operating thesis.
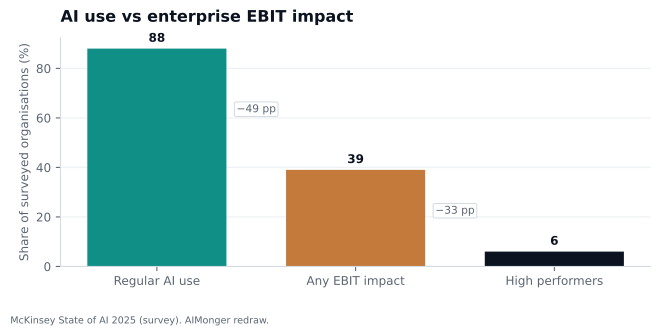
Figure 1. Regular AI use vs enterprise EBIT impact among McKinsey survey respondents. Plain read: most firms have AI somewhere; few can point to profit. On the P&L: ask for the bridge from seat count to EBIT line, not the adoption chart. Source: McKinsey State of AI 2025 (survey). AIMonger redraw.
McKinsey reports 88 percent of surveyed organisations use AI regularly in at least one function; 39 percent report any enterprise EBIT impact; about 6 percent qualify as high performers attributing more than 5 percent of EBIT to AI. The 88 percent figure is McKinsey-sourced; Stanford AI Index compiles related survey evidence, so do not treat it as an independent duplicate statistic.
Four mechanisms behind the paradox
- Tooling without redesign. Teams add a chat window to an unchanged process so usage dashboards rise while cycle time, error rate, and capacity hours stay flat on the P&L. A chat pane bolted onto a legacy workflow produces activity metrics without outcome metrics, which is how a programme accumulates spend without a surplus bridge. The dashboard reports engagement; the P&L reports nothing.
- Measurement theatre. Steering decks report tokens, seats, and pilot counts instead of workflow baselines, which lets spend grow while finance waits for a surplus bridge that never arrives. Activity metrics are easy to produce and hard to dispute, which is why they crowd out the baseline numbers finance actually needs. A deck that counts pilots is a deck that avoids the question of whether any pilot changed a metric.
- Coordination tax. Meetings about AI strategy consume more hours than the workflows save because nobody owns a graduated path from pilot to production with named metrics. The tax is invisible because it lands in senior calendars, not in the AI budget, but it is real cost that the surplus bridge rarely subtracts. A programme with more steering meetings than workflow releases is spending coordination hours it cannot reconcile to EBIT.
- Apprenticeship erosion. Juniors lose scaffold tasks to cheap first drafts while seniors absorb review load without a redesigned learning path, trading this year’s efficiency for next decade’s judgement gap. The cost is deferred, which means it does not appear in this year’s bridge, but it appears in three years when review quality degrades and nobody can explain why. Replacing scaffold without rebuilding the learning path is not productivity; it is deferred capability loss.
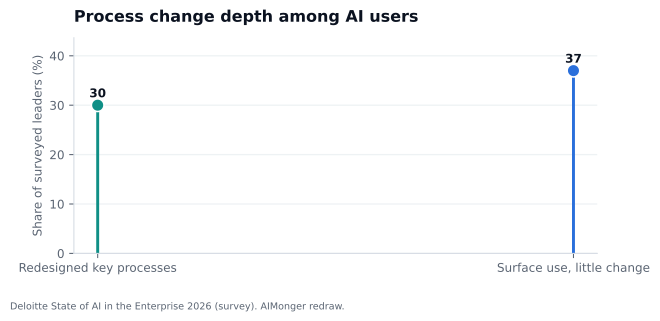
Figure 2. Redesigned processes vs surface-level use among Deloitte survey leaders. In short: access and pilots outrun process change. Worked case: the steering deck shows twelve pilots; only three changed a workflow metric. Source: Deloitte State of AI in the Enterprise 2026 (survey). AIMonger redraw.
Deloitte 2026 reports only 30 percent redesign key processes around AI; 37 percent report surface-level use with little or no process change; 25 percent moved at least 40 percent of experiments into production. Production without redesign imports cost without surplus.
Distinguishing productivity stories
| Story type | Evidence required | Common failure |
|---|---|---|
| Task productivity | Time-motion or ticket metrics on a workflow | Survey vibes only |
| Functional productivity | Department KPI movement | No baseline |
| Enterprise surplus | EBIT/margin/capacity bridge | Counting seats as value |
| Sector productivity | External studies (e.g. PwC exposure analysis) | Treating association as local proof |
Boards should demand the story type be labelled. Borrowed sector statistics do not substitute for a local bridge.
Junior pathways: the quiet strategic risk
Cheaper first drafts can remove the tasks that used to train junior staff. If leadership celebrates efficiency without redesigning apprenticeship, the firm saves this year’s cost and loses next decade’s judgement.
Apprenticeship scaffold, in short: the repetitive first-pass work that teaches judgement before someone signs the final output. Board reading: juniors no longer draft client memos from scratch; if nobody redesigned how they learn verification, partner review quality degrades in three years.
Board response:
- Separate scaffolds from waste. Leadership identifies which junior tasks teach verification and judgement versus pure rework so AI pair methods preserve learning instead of deleting the apprenticeship path. The distinction matters because a scaffold task looks like waste on a time-motion study but is actually the curriculum that produces next year’s reviewers. Cutting a scaffold saves hours today and costs judgement in three years.
- Deliberate scaffold retention. High-value scaffold tasks stay in the curriculum, possibly with AI-assisted pair workflows, so juniors still earn promotion readiness while throughput improves on true waste. Retention is a design choice, not a default, because the cheapest path is always to delete the scaffold and let the model draft. Pairing the scaffold with an AI workflow keeps the learning while capturing the speed.
- Review quality and promotion metrics. Boards track review quality and promotion readiness alongside handle time so efficiency gains do not mask a hollow talent pipeline three years out. Handle time is a leading indicator of cost; promotion readiness is a leading indicator of capability, and a board that watches only the first is governing half the asset. A falling handle time with a falling promotion rate is the signature of apprenticeship erosion.
- Verification-focused training funding. Mandatory training teaches refusal, provenance reading, and escalation, not only prompting tricks, so juniors graduate into reviewers who trust but verify. Prompting tricks produce faster drafts; verification training produces reviewers who can catch a confident wrong answer before it reaches a client. Funding the second is what prevents the paradox from moving one seat up the seniority ladder.
This matters acutely in professional firms, where apprenticeship, local judgement, and client trust are part of the operating asset. Replacing junior scaffolds without rebuilding the learning path is not productivity. It is deferred capability loss.
Converting activity into surplus
| Move | Paradox effect |
|---|---|
| Pick three workflows with baselines | Makes surplus measurable |
| Kill permanent pilots | Stops spend without learning |
| Train operators | Converts seats into capacity |
| Route models by complexity | Stops cost runaway |
| Report capacity hours + quality | Gives finance a bridge |
Eurostat’s 20.0 percent EU enterprise AI adoption rate (2025) means many peers still have not started. That is not comfort. It is a warning that when they start, they may skip straight to seat purchases and deepen the paradox industry-wide. Absorbers who redesign work will still look quiet, and more profitable.
Building an EBIT bridge (even if small)
Finance does not need miracles. It needs a bridge:
- Hours removed times loaded cost. Document hours removed from a named workflow multiplied by fully loaded labour cost so surplus appears as capacity finance can reconcile to headcount and overtime lines. The bridge converts an abstract efficiency claim into a number finance can audit, which is the only form of surplus that survives a budget review. Hours removed without a loaded cost is a vendor chart, not a bridge.
- Error and rework reduction. Quantify rework and error-rate reduction times cost-of-error so quality improvements count in the bridge, not only speed claims from vendor dashboards. Quality gains are often larger than speed gains, but they are harder to measure, which is why they are usually omitted. Including them is what stops the bridge from undervaluing the workflows that matter most to customers.
- Cycle-time revenue only when evidenced. Revenue acceleration from faster cycle time enters the bridge only when baseline and causal evidence exist, preventing speculative top-line credit from pilot enthusiasm alone. Revenue claims are the most contested line in any bridge, because a faster cycle does not automatically produce more revenue. Evidencing the link, rather than asserting it, is what keeps the bridge defensible to finance.
- Subtract all programme costs. Model, integration, review, and training costs subtract explicitly so the board sees net surplus, not gross task savings that ignore operating overhead. Gross savings that ignore review and training costs overstate surplus by the exact amount of the hidden operating tax. Net surplus is the number that determines whether the programme graduates from exploration to transformation.
If the bridge cannot be drafted, the programme is still in exploration; fund it like exploration, not like transformation.
PwC’s 2025 AI Jobs Barometer finds revenue-per-employee growth 3x higher in industries most exposed to AI versus least exposed, and a 56 percent wage premium for AI-skilled workers. That is association, not proof your firm captured surplus. It supports investing in complements: workflow redesign, skills, data access, evaluation.
Leading versus lagging indicators
| Leading | Lagging |
|---|---|
| Training completion | EBIT bridge |
| Workflow attachment rate | Margin impact |
| Eval coverage | Customer cycle time |
| Permission backlog cleared | Capacity hours sustained |
Boards that only look at lagging indicators will cancel too late or too randomly.
Organisational design choices that worsen the paradox
- Centre of excellence without P&L. A central AI team that owns demos but no workflow P&L produces activity theatre while process owners who control metrics remain uninvolved and unchanged. A centre of excellence without a budget line for outcomes will optimise for demo quality, because demos are what it can show, and outcomes belong to someone else. The fix is to attach the centre to a workflow P&L, not to abolish it.
- Pilot sprawl without graduate path. Every department runs experiments with no shared criteria to graduate, pause, or kill, so spend accumulates across permanent pilots that never touch a finance-accepted KPI. A pilot without a graduate criterion is a cost centre disguised as innovation, because it never has to produce a surplus to survive. Shared criteria are what convert a portfolio of pilots into a portfolio of decisions.
- Senior review pile-up. Review work shifts entirely onto partners and seniors without hiring or training redesign, which saves junior hours today and destroys review quality tomorrow. The pile-up is invisible in the budget because review hours are absorbed into existing senior roles, but it is real cost that eventually surfaces as attrition or error. Redesigning the review load, rather than absorbing it, is what keeps the gate sustainable.
- Licences in IT, owners elsewhere. Tool budgets sit with IT while business process owners lack authority to change queues, which guarantees seats without redesigned workflows or surplus on the P&L. The split produces a programme where the buyer and the operator never meet, which is how a firm ends up with thousands of seats and zero workflow metrics. Moving the budget beside the workflow owner is the structural fix, not a new steering committee.
Worked example: customer support draft-and-gate
Before: Agents draft every response from scratch. Average handle time flat. AI spend visible; surplus invisible.
After redesign: Model drafts from policy and prior tickets; agent edits and sends. Metric: handle time, rework rate, customer satisfaction, not “AI emails sent.”
Surplus bridge (illustrative):
- Ticket time savings times volume. Four minutes saved per ticket across five hundred daily tickets, multiplied by loaded agent cost, produces a capacity line finance can track month over month against baseline. The calculation is deliberately conservative, because it counts only time saved, not revenue claimed, which keeps the bridge defensible. Four minutes looks small until it is multiplied by volume and loaded cost, at which point it becomes a headcount line.
- Programme cost subtraction. Model inference, spot-check reviewers, and certification hours subtract from gross savings so the board sees net surplus instead of gross task-speed claims alone. Gross savings that ignore review and training costs overstate surplus by the exact amount of the hidden operating tax. Net surplus is the number that determines whether the programme graduates from exploration to transformation.
- Monthly finance reporting with baseline date. Finance receives the bridge monthly with a baseline dated before go-live so attribution debates happen on evidence, not on seat-count charts alone. A baseline dated before go-live is what makes the bridge auditable, because it gives finance a before-and-after to reconcile. Monthly cadence is what catches a stalling metric before it becomes a cancelled programme.
Paradox trap avoided: seat count rose, but workflow metric moved because process owner had authority to change the queue.
Talent compact (board-visible)
Publish internally:
- Skills that gain value. Name which judgement, verification, and domain skills become more valuable after redesign so staff invest in the right capabilities instead of fearing generic replacement narratives. Naming the skills is what converts a vague reassurance into an investment guide, because staff cannot prepare for a capability they cannot name. The list also tells training where to focus, which closes the loop between the compact and the curriculum.
- Junior judgement pathway. Explain how juniors will still learn verification and client-ready quality when first drafts become cheap, which prevents silent attrition among early-career staff. A pathway that is not explained is assumed not to exist, and early-career staff who cannot see a path will find one elsewhere. The explanation is also a recruiting asset, because candidates ask exactly this question in interviews.
- Mandatory production training. List training required before production AI access so licence rollout cannot outpace operator competence and recreate the paradox inside the sanctioned tool. Tying access to training is the single most effective control against shelfware, because it stops a procurement date from overriding a readiness assessment. The list also gives the trainer a published standard to certify against.
- Changed performance expectations. Clarify how roles, review load, and promotion criteria shift after absorption so performance management aligns with the new workflow instead of punishing people for using approved tools. Without this clarity, staff are simultaneously told to use AI and penalised for the workflow changes it requires, which is the contradiction that produces shadow use. Aligning performance management with the workflow is what makes the sanctioned path the easier path.
Silence produces rumours. Rumours produce shadow AI and attrition.
Evidence base: activity without redesign produces weak enterprise surplus
| Source | Finding | Paradox mechanism |
|---|---|---|
| McKinsey State of AI 2025 | 88% regular use; 39% any EBIT impact; ~6% high performers >5% EBIT | Use widespread; surplus concentrated |
| Deloitte State of AI 2026 | 30% redesign processes; 37% surface use; 25% moved 40%+ experiments to production | Pilots outrun redesign |
| PwC AI Jobs Barometer 2025 | 3x revenue-per-employee growth in most AI-exposed industries; 56% wage premium | Productivity where work adapts |
| Eurostat 2025 | 20.0% EU enterprises use AI | Many still early; can import paradox |
| Gartner 2025 | 40%+ agentic projects predicted cancelled by 2027 | Unclear value kills spend |
| Stanford AI Index 2026 | Task-level gains in selected settings; enterprise impact uneven | Task ≠ enterprise surplus |
Plain read: experimental studies report meaningful task-level productivity gains in selected settings, while enterprise surveys show firm-level EBIT and process redesign remain uneven. Local speed-ups do not automatically become enterprise surplus.
Methodology note
McKinsey and Deloitte are executive surveys with different samples and questions. PwC combines nearly a billion job ads with company financial analysis; industry exposure is observational. Eurostat is representative enterprise survey for AI technology use, not ROI. Treat triangulation as directional evidence for management priorities.
Counter-position: the lag is normal and temporary
Another board might argue enterprise IT always shows delayed productivity, because organisations incur implementation cost before complementary investments produce surplus. That argument supports measuring the lag, not ignoring redesign. If complementary investments in process, skills, and data access are absent, the lag can become a permanent cost centre.
Board decision criteria (CFO pack)
Quarterly surplus pack must include:
- Hours removed with baseline date. Every workflow reports hours removed times loaded cost against a dated baseline so finance can audit surplus claims instead of accepting adoption graphs alone. The baseline date is what makes the claim auditable, because it gives finance a before-and-after to reconcile. Without it, the pack is a vendor scorecard, not a board instrument.
- Rework and error reduction valued. Rework-rate and error-cost improvements appear in the pack with the same rigour as speed claims so quality moves count toward enterprise surplus. Quality gains are often larger than speed gains but are omitted because they are harder to measure, which systematically understates the workflows that matter most to customers. Including them is what stops the bridge from rewarding the wrong work.
- Cycle-time revenue when proven only. Revenue effects from faster cycle time enter only when causal evidence exists, preventing speculative top-line credit from steering enthusiasm alone. Revenue is the most contested line in any bridge, because a faster cycle does not automatically produce more revenue. Evidencing the link is what keeps the bridge defensible to a sceptical CFO.
- Full programme cost subtraction. Model, integration, review, and training costs subtract explicitly each quarter so net surplus is visible beside gross task-level wins. Gross savings that ignore review and training costs overstate surplus by the exact amount of the hidden operating tax. Net surplus is the number that determines whether the programme graduates from exploration to transformation.
- Junior pathway health indicators. Promotion readiness, review quality, and scaffold retention metrics show whether efficiency today is borrowing from capability tomorrow. These indicators are leading, not lagging, which means they surface the deferred cost before it appears as a review-quality collapse in three years. A falling promotion rate alongside rising efficiency is the signature of apprenticeship erosion.
- Labelled productivity story type. Each claim is tagged as task, functional, enterprise, or sector productivity so boards do not treat borrowed industry statistics as local EBIT proof. The label is a discipline, because it forces the presenter to state what evidence would refute the claim. A sector statistic presented as enterprise surplus is the most common form of measurement theatre.
- Graduate, pause, or kill per pilot. Every pilot receives an explicit graduate, pause, or kill decision so permanent experiments stop consuming budget without learning or surplus. The decision is what converts a portfolio of pilots into a portfolio of outcomes, because a pilot without a verdict is a cost centre disguised as innovation. Publishing the verdicts is also what gives the steering group a credible graduation path for the next cohort.
Appendix: paradox diagnostic (score 0-2 each)
- Workflows redesigned. Score whether priority workflows changed queues, gates, and metrics, not only added a chat pane, because redesign is the main escape route from activity without surplus. A chat pane is the cheapest thing a vendor can ship and the most expensive thing a board can fund without a metric move. Redesign is the difference between a tool and a result.
- Finance-accepted metrics. Score whether finance signed off on baselines and bridges so surplus claims survive audit instead of living only on vendor adoption dashboards. Finance acceptance is what converts an engineering claim into a board-credible number, because finance owns the baseline the bridge is measured against. Without it, the dashboard reports whatever the vendor chose to show.
- Mandatory training enforced. Score whether production access requires certification so seat rollout cannot outpace operator competence and recreate cost without capacity gain. Tying access to training is the single most effective control against shelfware, because it stops a procurement date from overriding a readiness assessment. Enforcement, not policy, is what makes the gate real.
- Kill criteria enforced. Score whether pilots actually pause or die when metrics stall, because permanent experiments are the most expensive form of measurement theatre. A pilot without a kill criterion is a cost centre disguised as innovation, because it never has to produce surplus to survive. Enforcement is what converts a portfolio of pilots into a portfolio of decisions.
- Junior pathway redesigned. Score whether apprenticeship scaffolds and promotion criteria were updated when first drafts became cheap, preventing deferred capability loss. The redesign is the difference between capturing efficiency and borrowing from capability, because a scaffold removed without a replacement produces a review-quality gap in three years. Scoring this forces the conversation before the gap appears.
- Cost routed by complexity. Score whether model routing and FinOps caps stop heavy jobs from burning budget on tasks a smaller model could handle at lower cost. Routing is the control that keeps token spend proportional to the value of the task, because a large model on a trivial job is the most common form of FinOps waste. Caps are what stop a stuck loop from consuming a month of allocation overnight.
Score ≤4: paradox likely entrenched. Score ≥9: impact possible.
Closing position
The productivity paradox is a management failure mode, not a law of nature.
Boards that insist on redesigned workflows, talent pathways, and surplus metrics will escape it. Boards that fund activity will keep asking why the P&L does not move.
References
- McKinsey & Company / QuantumBlack, “The State of AI: Global Survey 2025.” https://www.mckinsey.com/capabilities/quantumblack/our-insights/the-state-of-ai
- Deloitte AI Institute, “The State of AI in the Enterprise: The Untapped Edge” (2026 edition); survey of 3,235 leaders, Aug-Sep 2025. https://www.deloitte.com/us/en/what-we-do/capabilities/applied-artificial-intelligence/content/state-of-ai-in-the-enterprise.html
- PwC, “The Fearless Future: 2025 Global AI Jobs Barometer,” 3 June 2025. https://www.pwc.com/gx/en/news-room/press-releases/2025/ai-linked-to-a-fourfold-increase-in-productivity-growth.html
- Eurostat, “20% of EU enterprises use AI technologies,” 11 December 2025 (20.0% in 2025; 13.5% in 2024). https://ec.europa.eu/eurostat/en/web/products-eurostat-news/w/ddn-20251211-2
- Gartner, “Gartner Says More Than 80% of Enterprises Will Have Used Generative AI APIs or Deployed Generative AI-Enabled Applications by 2026,” press release, 11 October 2023. https://www.gartner.com/en/newsroom/press-releases/2023-10-11-gartner-says-more-than-80-percent-of-enterprises-will-have-used-generative-ai-apis-or-deployed-generative-ai-enabled-applications-by-2026
- Gartner, “Gartner Predicts Over 40% of Agentic AI Projects Will Be Canceled by End of 2027,” press release, 25 June 2025. https://www.gartner.com/en/newsroom/press-releases/2025-06-25-gartner-predicts-over-40-percent-of-agentic-ai-projects-will-be-canceled-by-end-of-2027
- Stanford Institute for Human-Centered Artificial Intelligence, “The 2026 AI Index Report,” Economy chapter. https://hai.stanford.edu/ai-index/2026-ai-index-report/economy
- OECD AI publications hub. https://oecd.ai/en/ai-principles
- NIST AI 600-1 GenAI profile. https://nvlpubs.nist.gov/nistpubs/ai/nist.ai.600-1.pdf
- Regulation (EU) 2024/1689 (EU AI Act). https://eur-lex.europa.eu/eli/reg/2024/1689/oj